
By Benjamin Nobel, 5/9/2020
On Thursday of last week, CBCS announced their long-awaited census — or “Population Report” as they are calling it — revealing the counts and grades for each of the books that have passed through their doors since the time they first appeared on the scene as CGC’s primary competitor in the comic book grading business.
For newsstand-focused collectors such as myself, this new research tool is going to provide a treasure trove of data that CGC hasn’t been able to give us, because ever since April of 2017, CBCS has been distinguishing newsstand versus direct edition on their labels and in their records (at least for books up until the year 2000; unfortunately after that arbitrary publication date we’re out of luck). And, from the beginning CBCS has been distinguishing Canadian Price Variants as well, as distinctly-labeled census variants — initially denoting them as “Canadian Edition” and then since October 2018 denoting as “75¢ Canadian Price Variant” (and similar, depending on actual cover price).
All of this data in turn is now available in the new population report! Yippee!! 🙂 But given all the changes to their labeling over time, the numbers revealed in the new population report are a little tricky to work with when it comes to issues with US newsstand and CPV variants because there are more census entries than there are actual variants of each issue.
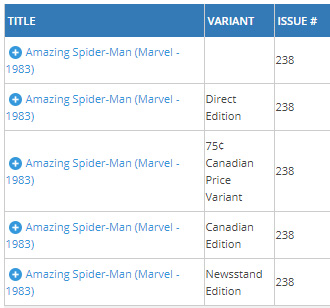
To illustrate this trickiness, and to lay out how I think it makes sense for us to look at the CBCS census data when exploring relative rarity, consider Amazing Spider-Man #238. Marvel published three different “triplets” when this book was manufactured, i.e. three versions manufactured on the same equipment with identical indicia and interior pages, and with the exact order of birth among the triplets unknown (thus all three have equal claim on being 1st print copies).

But instead of three matching entries in the CBCS census report, they give us five entries: there’s an entry with a blank variant field for books where the US newsstand versus direct edition distinction wasn’t recorded for 60¢ cover price copies (the “old way”); there’s the old “Canadian Edition” entry for 75¢ cover price copies (the “old way”); there’s the new “75¢ Canadian Price Variant” entry for CPVs graded after October 2018; and there’s the “Direct Edition” and “Newsstand Edition” entries — the “new way” following their April 2017 announcement:
Much like television ratings, election polling, and Governor Cuomo’s recent Covid-19 antibody testing in NY all are done by taking a sample (a small portion of the population) to determine relative percentages among the sample, I believe that looking at the census data from CBCS can give us excellent information about the relative rarity among the three types of ASM #238 comics published, even though CBCS-graded books are just a small sample of the total copies out there in the world.
So: Is there a way to look at the new census data for the above 5 census entries for this book and translate that data down to the three actual types published? Here’s how I approach this question:
• First, I want to look at the 60¢ cover price copies and see the ratio of newsstand to direct edition copies using the “Newsstand Edition” and “Direct Edition” census entries. Unfortunately the sample size is still pretty small because CBCS is still young, but, let’s work with the data we have for now, and keep an eye on the population report numbers over time as more data accumulates. And the data we have for now, as of the May 9, 2020 population report for ASM #238, shows 141 direct editions against 102 newsstand editions. That’s 58% direct edition : 42% newsstand.
• Next, I’m going to apply that 58:42 ratio, against the “old way” census count from when the two types were still lumped together, i.e. let’s assume for this exercise that the ratio we see will be similar to that of the “broken out” copies that were graded post- April 2017. I recognize that this is an assumption, and we don’t know for sure; not only are the numbers smallish, but submission behavior might have actually changed as a result of the label change once it happened… but we have to work with the data set we have, not the ideal data that we want. So we’ll make the assumption and we’ll extrapolate. This extrapolation breaks the “lumped” census entry into 118 direct editions and 86 newsstand editions, bringing the “extrapolated total” to 259 direct edition : 188 newsstand edition.
• Finally, we can add together the “Canadian Edition” and the “75¢ Canadian Price Variant” counts: this gives us a total of 8 price variants across the two differently-named entries.
• So now we can input our three pie slices, revealing the relative rarity difference between the three types using the CBCS population report, as of the May 9, 2020 data:
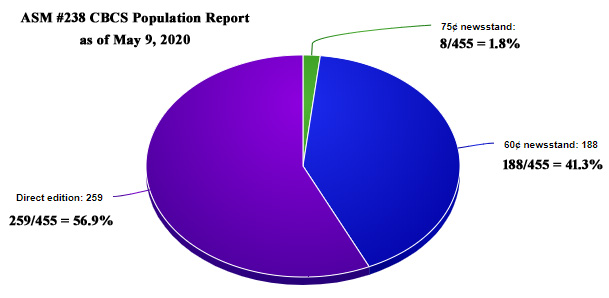
So that’s ~1.8% for the 75¢ variant of ASM #238 as a percentage of the total — and to think about such a percentage in the context of “modern variant terms” it is worth noting that “1:50” as a percentage is 1 divided by 50 which is 2%, so that’s good context for wrapping our heads around the price variant relative rarity level seen on the CBCS census today for this issue. Meanwhile the US newsstand version made up 41.3% and the direct edition made up 56.9%.
So that “walk-through” above is how I’m approaching the CBCS census data. Performing this same type of exercise should be interesting for many other books as well; it will be interesting to study how the rarity numbers trend for certain titles compared to others, and also for later years compared to earlier years (not to mention publisher vs. publisher).
There are thousands of books to potentially study ultimately, but for a quick look at some interesting keys and to satisfy my own curiosity for today, I performed the same exercise as done with ASM #238 above, for a number of other comics.
First, I took a quick glance at the universe of Canadian Price Variants through time, using some of my favorite Marvel & DC CPVs by year, picking one key book for each year from 1982-1988; I found the following relative rarity data (again this is all using the May 9, 2020 data from CBCS, which for the table below is for a total of 5,179 submissions, and we’ll have to see how the numbers fill out as time passes and more data accumulates):
| Year | Book | Direct Edition | Newsstand Edition | |
| Regular | Price Variant | |||
| 1982 | Wolverine #2 (1st Full Yukio) | 80% | 18% | 1.5% |
| 1983 | ASM #238 (1st Hobgoblin) | 57% | 41% | 1.8% |
| 1984 | Secret Wars #8 (Symbiote Origin) | 79% | 19% | 1.4% |
| 1985 | Web of Spider-Man #1 (1st Vulturions) | 88% | 11% | 1.4% |
| 1986 | X-Factor #6 (1st Apocalypse) | 78% | 21% | 1.2% |
| 1987 | Batman #404 (Year One Part I) | 94% | 5% | 0.7% |
| 1988 | Batman #423 (Todd McFarlane Classic) | 82% | 17% | 1.3% |
Over in our CPV price guide intro section we presented survivorship estimates for 1980’s Marvel & DC CPVs as a group, estimating ~80% direct edition, ~18% regular newsstand, and ~2% newsstand price variants, and in the detailed explanation page we talked about how the percentage of total sales shifted towards direct edition prevalence sometime near the middle of the 1980’s; since the variants were a newsstand-only phenomenon, this would drive the variant percentage to be higher towards the beginning of the variant window, and lower towards the end of the variant window, all else equal. The CBCS census data will no doubt help with researching newsstand percentages in more detail, not just by year and by publisher, but issue-by-issue.
And moving into the 1990’s and another section of the world of cover price variant comics, I was also curious to look up CBCS census data for Marvel’s two big APVs: the New Mutants #98 $1.50 Australian Price Variant and the Amazing Spider-Man #361 $1.80 Australian Price Variant. As it turns out, CBCS has only graded one of each variant to date, but it is still interesting to see the direct edition : newsstand : price variant ratios on census as of today for these two mega-key comic books:
| Year | Book | Direct Edition | Newsstand Edition | |
| Regular | Price Variant | |||
| 1991 | New Mutants #98 (1st Deadpool) | 76% | 24% | 0.04% |
| 1992 | ASM #361 (1st Full Carnage) | 60% | 40% | 0.06% |
Here are a few other books of the late-1980’s and 1990’s, ones that don’t have Type 1A price variants but where I was still interested to see the direct edition : newsstand percentage on census:
| Year | Book | Direct Edition | Newsstand |
| 1988 | ASM #300 (1st Venom) | 67.2% | 32.8% |
| 1988 | Hulk #340 (McFarlane Classic) | 81.0% | 19.0% |
| 1990 | Uncanny X-Men #266 (Gambit) | 78.4% | 21.6% |
| 1990 | New Mutants #87 (Cable) | 80.7% | 19.3% |
| 1992 | Spawn #1 | 91.4% | 8.6% |
| 1993 | Batman Adventures #12 (1st Harley Quinn) | 83.8% | 16.3% |
Unfortunately CBCS decided only to break out the newsstand vs. direct edition difference through the end of the 1990’s (hopefully one day they’ll extend that, because ending at the year 2000 as they did is completely arbitrary, and the newsstand rarity discussions and estimates really have the newsstand numbers falling off a cliff into the 2000’s so it would have been great to measure those later newsstand books too). [Fortunately, CGC meanwhile does break out some of the newsstand comics of the 2000’s when they are cover price variants of the issue number, such as the $3.99 cover price newsstand comics whose direct edition counterparts are priced $1 lower at $2.99, so we can study census data over there at CGC for those.]
But while CBCS’s new census doesn’t help us study relative rarity data into the 2000’s through to the end of the newsstand distribution era, it can help us see some data for the beginning of the direct edition era, which is also a quite fascinating period to look into. Some of the estimates out there for the very early direct editions have the year 1979 for example at 90-94% newsstand at time of distribution. Even after layering on the notorious newsstand destruction rate (with direct editions meanwhile tending to be purchased by collectors and carefully preserved), surviving direct editions from this “early” time-frame sometimes seem much harder to find out there in the marketplace; will they show up with smaller numbers on the CBCS census? Let’s check a couple of big keys.
I consider any direct editions with the bar-code strike-through instead of a graphical logo (like the Spidey Head) to be “early” direct editions [if you are unfamiliar with the newsstand vs. direct edition difference, see Comic Book Newsstand Editions: Understanding The Difference]. One example key with a bar-code strike-through being Amazing Spider-Man #194 (1st Black Cat). And before 1979 there are the No Month Variants / Pre-Pack Editions / Whitman 3-Pack Variants like Spectacular Spider-Man #27 which has just a blank box in place of a bar code (on CBCS’s census, instead of calling them “Direct Edition” CBCS uses “3-Pack Variant”). What is the newsstand : direct CBCS census breakdown for these early direct-sold examples? Here are the current numbers (once again based on the 5/9/2020 CBCS census data):
| Year | Book | Direct | Newsstand |
| 1977 | Spectacular Spider-Man #27 (1st Frank Miller Daredevil) | 11.8%* | 88.2% |
| 1979 | Amazing Spider-Man #194 (1st Black Cat) | 36.9% | 63.1% |
* I don’t know if “3-Pack Variant” tracking began at CBCS at the same time as the newsstand/direct break-outs, or if it began from the beginning; there are 4 books classified “3-Pack Variant” against 30 “Newsstand Edition” and 36 without a designation for Spectacular #27; in the above I have counted the 4 against only the “Newsstand Edition” copies yielding 4/34=11.8% but the proper comparison might also be to add in the 36 unclassified copies if “3-Pack Variant” dates back to the beginning, in which case it would be copies 4/70=5.7% — either way the 3-pack variants are clearly the more rare type on census.
And the final book I looked up today is Wolverine Limited Series #1, published in 1982 when we’d expect to still be seeing mostly newsstand copies dominating Marvel’s sales, and yet, much like we see when studying marketplace availability for this issue, the bulk of CBCS graded copies of the issue on record to date are direct editions — about 3 of every 4:
| Year | Book | Direct | Newsstand |
| 1982 | Wolverine Limited Series #1 | 75.4% | 24.6% |
The newly launched CBCS census is a great research tool for newsstand-focused collectors; there are soooo many other books we can check out, and it is also fascinating to drill down into the 9.8 grade and compare the types surviving in that coveted NM/MT condition, but for now I’m going to end this post here [5/16 update: here’s another post, studying CBCS census newsstand rarity by year]. If you’re curious about other books yourself, here’s a direct link to the new CBCS census: https://www.cbcscomics.com/population-report/
Happy Collecting! 🙂
– Ben

Interesting to see this because I have collected data on this issue from auctions held by Heritage. The numbers I have for that are:
Direct edition graded 9.2 and up: 95
Newsstand edition graded 9.2 and up: 18
Direct edition graded 9.0 and below: 14
Newsstand edition graded 9.0 and below: 9
Total Direct: 109
Total Newsstand: 27
What these numbers indicate is that:
1) Direct editions in high grade (9.2+) appeared at auction 5.28 times for every Newsstand edition in similar grade.
2) Lower grade direct editions appeared at auction 1.56 times as often as newsstand editions in similar grade.
3) Overall, Direct editions were 4.04 times as numerous as newsstand editions. This number is skewed in favor of high grade issues because they are more common at auction than lower grades.
AP
LikeLiked by 1 person
BTW, I’ve had so much fun restarting my comic book collection that I decided to draw up some sample pages and maybe get back in the industry. You can see them here: https://www.paqart.com/commercial-art/comics
LikeLiked by 1 person
Awesome!!
LikeLike
So how do they rate the Australian price variants, which were published before any of these editions?
LikeLike
Similar in that they previously labeled them “Australian Edition” but changed to “$1.50 Australian Price Variant” (or similar depending on the actual price). So for example when one searches on New Mutants #98, the below is what comes up:
The first and last entries look to be an error with the wrong year inputted; the 2nd entry is the “old way entry” with direct editions and newsstand lumped together, then there are the post- April 2017 entries for “Direct Edition” and “Newsstand” and finally they have the “$1.50 Australian Price Variant”
LikeLike