
By Benjamin Nobel, November 2019
Hi everyone, we have just published The 2020 CPV Price Guide for 1980’s Canadian Price Variants (Type 1A), which once again includes a fantastic Market Reports & Articles section featuring must-read reports from fellow guide collaborators as well as guest contributors.
My fellow collaborators have already done a great job discussing the state of the CPV market and presenting example sale highlights, so for my own report for this year’s guide I decided I would take a detailed look at one of the features we added last year (and included again this year): the Most Actives Table (ranking issues by the highest CGC census volume year over year). [This year I also co-authored a separate article for our Market Reports & Articles section which I hope you will check out too, The Quebec Effect.]
The Most Actives Table is basically a big data table with loads of numbers, and one of the reactions/feedback I received last year is that it was kind of overwhelming at first. So my hope is that by “walking through” the table and pointing out some data that surprised me (and why), it will help guide readers to see what this particular guide feature is useful for… And to start, let’s just review what the data columns are, by zeroing in on row #1 column #1 in the table: Marvel Super Heroes Secret Wars #8

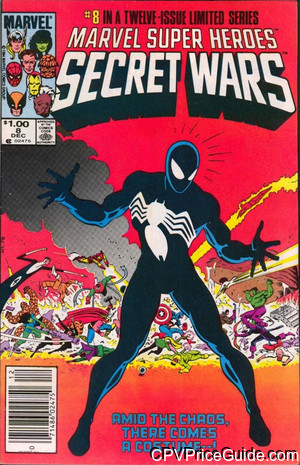
Looking at the above picture, I have highlighted Marvel Super Heroes Secret Wars #8 in a red box [note: in the actual guide, the title is a hyperlink which you can click, but in this post I’m using screenshots/images so they are not actually clickable]. Now let’s move to the next column:

This next column contains the census counts [each year we’ve started working on our guide in July/August, so the census snapshots we’ve used have been from that timeframe — for last year’s guide the snapshot is from 8/21/2018, while for this year’s guide the snapshot is from 8/27/2019].
In the highlighted box you will see these two numbers: 13,321 and 117. Where did these two numbers come from? If you were to look up Secret Wars #8 on the CGC census online, you would see a census entry that has two sections — a top section which counts the “regular” copies (the ones with 75¢ cover price in this case) detailing the number of copies that have been through CGC’s doors for grading since their inception, and a bottom section which counts the Canadian Price Variant copies ($1.00 cover price in this case). Below is an annotated screenshot of the CGC census page for Secret Wars #8 to point out where the numbers in our Most Actives Table came from:

As you can see above, this is a screenshot illustrating what the CGC census page looks like for Secret Wars #8 on an online lookup: the top box in red shows the title, issue number, issue date and year, publisher, and then “Key Comments” (and “Art Comments”). Below that are the census counts for “regular” copies in various grades and at the bottom right of that section the one number we’re concerned with in regard to the Most Actives Table, is the box highlighted in red: the grand-total count of regular copies of the issue number that CGC has graded since the company’s inception. And then for the CPV section, we want that same grand-total copy count.
Thus for Secret Wars #8, the Most Actives Table is listing the 13,321 count of “regular” copies at 8/27/2019, and the 117 count of cover price variant copies:
And already at this point we have some very interesting data, because we don’t just have one “lone number” but rather we have a pair of numbers that we can compare: As of August 27th of this year, CGC had graded thirteen thousand three hundred twenty one regular-cover-priced copies of Secret Wars #8, versus one hundred seventeen cover price variants.
We must remember that CGC-graded copies are just a small minority of the total copies out there; but much like election polling and television ratings are compiled by sampling the opinions/viewing-habits of a small portion of the public, similarly, comparing the regular-vs-CPV CGC census numbers can be illuminating for what they reveal about the relative rarity!
But while the numbers in the second column are great to know, the big-picture idea of the Most Actives Table is really all about that third and final column. And here’s how we get there: Last year, we took this very same “snapshot” of the census numbers for every issue in our guide … and now we have the numbers for this year. Which in turn lets us calculate how many copies have passed through CGC’s doors just in the past year:

And this final column highlighted above, is really the “meat” of the Most Actives Table: we’re seeing that for Secret Wars #8, since the time of the census snapshot used in our last guide, a whopping 2,090 “regular” copies have hit the CGC census, along with 39 price variants. That “regular” copy count — the two thousand and ninety new “regular” copies that have hit the census in the past year — is a little bit like the number of votes in a year-long popularity contest. And this issue as a Venom Key has been the #1 most-popular-by-submission-volume book out of any other in our entire guide, both last year and this year. That’s worth knowing!
As an aside, something I find absolutely stunning to contemplate is the idea that every single one of those 2,090 newly-graded regular copies has to find a home (or, found one already during the course of the past twelve months). Said another way, there has to be collector demand out there for all 2,090 new graded copies. What percentage of those collectors who own those newly-graded copies are actually aware of the existence and appeal of the $1.00 cover price variant? After all, Overstreet has yet to list them in their guide (hence the “hole” that our guide fills)… so collector awareness about CPVs is likely still a very small percentage. Can you imagine the supply:demand imbalance that would ensue if each one of those collectors seeking Secret Wars #8 preferred to own the price variant instead of a regular copy? The way any collector of Star Wars #1 would prefer to own the 35¢ variant instead of the “regular” 30¢ cover priced version if given the choice? But I digress… let’s bring the conversation back to the Most Actives Table!
What we’re doing next in the table is then ranking the entire universe of CPVs covered in the guide, by how many new “regular” copies have been added to the CGC census in the past year. If we think of each new regular copy as being a “vote” in a year-long popularity contest, then the resulting table is basically the outcome of the popularity contest! In this way, it can teach us which issues are particularly “in focus” and being submitted in large numbers lately.
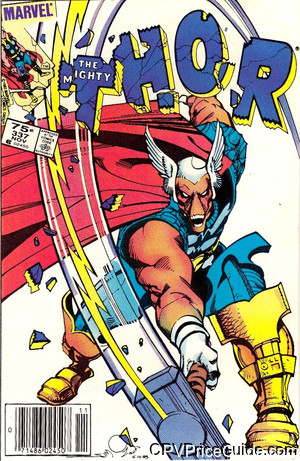
Last year, the top three on the list were Secret Wars #8, Amazing Spider-Man #252, and New Mutants #1 (movie buzz); while this year featured the same top two, but Thor #337 rocketed up the list to the #3 spot. In fact, looking at that Thor row, almost a third of all copies of Thor #337 ever graded were graded in the past year! And there was also a surge of CPVs submitted, almost as if some collectors or dealers had been sitting on a load of them and then decided to “cash them in” on all the buzz around Beta Ray Bill in the past year (Thor #337 features his 1st appearance and a “Modern Classic Cover” by Walt Simonson).

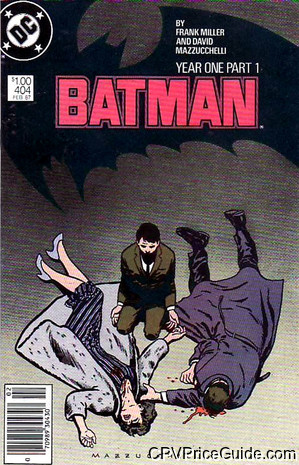
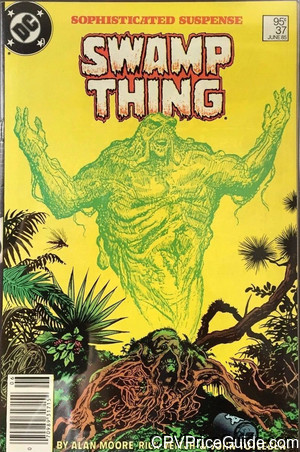
And just as Thor #337 surprised me by the big increase in CPV copy count this year, I have also been surprised by two popular key issues that have seen shockingly small increases in CPV copy count, both this year and last year: Batman #404 (Frank Miller’s “Year One” storyline begins) and Saga of the Swamp Thing #37 (1st full appearance of John Constantine). In last year’s Most Actives table, Batman #404 caught my eye with zero year-over-year CPV submissions while Swamp Thing #37 had just three. And this year the shockingly-low numbers for these two CPVs continue:

WOW. We knew that Marvel was dominant in the 1980’s but I think the above really highlights something that I keep hearing over and over again from my fellow collaborators: a lot of the big DC CPVs are shockingly hard to find, especially when compared against Marvel.
For Batman #404 there are still just five CGC-graded CPVs on record to date to divide up amongst the entire collector base in this niche. You can count them all on one hand! That is stunning to me (there have got to be more out there than this… maybe there are a bunch out there “mis-labeled” by CGC or maybe collectors sent them to CBCS?). And Saga of the Swamp Thing #37, an even more highly-valued key, has just fourteen CGC-graded CPVs on record for us to all fight over. Furthermore, when we drill down into the census data, we see that the number of 9.8 price variant copies on record for each of these two particular books is zero. In both cases, 9.6 still remains the highest grade on record on the CGC census, for the price variant. WOW.
I really thought that “three guides in” for our CPV guide, and with many CPV sales examples above $1000, we would have seen collector awareness about CPVs increase enough that some of the more elusive variants I’ve been hunting for years and years in top grade would “come out of the woodwork” … but in so many cases, the census numbers for the variants remain minuscule! And so many still lack even a singular 9.8 census copy! So where the heck are these elusive DC books? Are there collectors out there quietly hoarding them without submitting any for grading? Or are they basically just not out there? I suppose time will tell!
Happy CPV collecting! 🙂 I hope reading this post helps you to now look at the most actives table with fresh eyes!
– Ben p.s. Fun fact: the very first CPV to appear on CGC’s census was Amazing Spider-Man #252 which appears in the July 2001 census snapshot (thanks to Greg Holland whose website has that 2001 snapshot!). A baby born on that date is now an 18-year-old adult able to vote!
