
By Benjamin Nobel, June 28, 2016
A practical guide for how to actually find/identify these variants out there in the marketplace.
Although you’ll often see the term “75 cent variants” used for this “class” of comic book rarities (here’s how that phrase may have originated), they differ from earlier price variant windows (for example the earlier “35 cent variants”) in that the window in this case was fairly large by contrast — spanning multiple years in fact — and because ‘regular’ prices for comics varied (and rose over time) over that multi-year period, the higher cover price copies (i.e. the ultra-rare ones) aren’t always going to be priced at 75 cents, all depending on the comic in question and the publication year.
So: collectors can’t just assume any comic published during our window of 10/1982 to 8/1986 for Marvel (and out to 9/1988 for D.C.) priced at 75 cents and having a barcode on it is one of the rare price variants… collectors instead need to understand how to determine and spot the variant prices for any given issue, and consider them case by case to be certain! Here’s my foolproof 3-step technique for figuring out the variant cover price for any comic published during our variant window, and spotting them listed for sale.
Step 1 — Find a direct edition copy online
This step is actually quite easy, because direct edition copies (the type sold in specialty comic shops) are both extremely prevalent and extremely easy to spot. The reason we’re looking for one, is because once we’ve found one it will give us the critical information we need for steps 2 and 3. An easy way to find a direct edition copy online is to do an eBay search. We want a good scan where we can zoom in, so we’ll search for a CGC graded copy (which tend to have high quality scans, but any good picture will do).
Example:
Suppose for example we want to find the rare Canadian price variant for X-Factor #6… Our first step is to find a direct edition copy so let’s search eBay for “x-factor 6 CGC.” We’ll then scroll through the results until we see one with the “Spider-Man Rectangle” in the bottom left corner (that logo in place of a barcode means we’ve found a direct edition copy). Chances are we won’t have to scroll too far, as direct edition copies have been extremely well preserved and are the most prevalent out there… I just did that search now, and sure enough, the very first result I found is a direct edition copy:

For my example for step 1, I searched “x-factor 6 cgc” on eBay, looking for a direct edition copy with the Spider-Man logo on the bottom left corner.
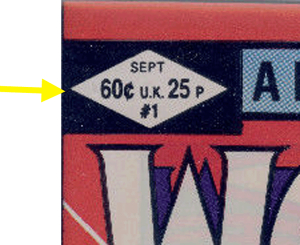
Step 2 — Zoom in on the price box
Having found a listing with a picture of a direct edition copy, our next step is to click that little magnifying glass icon to then be able to zoom in on the price box. Why are we doing this? Because: direct edition copies were manufactured by the publisher to cover both the US and Canada (and also the UK). That means we will find the information we need about the price charged for this issue in US dollars, and the price charged for this issue in Canadian dollars. The Canadian price will be the smaller price underneath.
Example:
Here’s a zoomed in look at the price box on the direct edition copy we found in step 1, and I’ve drawn an arrow to point out where to look — as you can see, the “main” price in large type is the US price of 75¢ and the Canadian price in smaller type underneath is 95¢:

What we’re looking for here are the different prices charged to the US and Canada. The US price is in large/bold type at the top, while the Canadian price is at the bottom in smaller lettering.
Step 3 — Now we can find our Canadian price variant
From the information obtained in step 2, we now know the two prices we will find out there for newsstand copies. Newsstand copies will have a bar code instead of a logo on them, in the bottom left corner of the front cover. So all we need to do in Step 3 is to search for our issue broadly (“x-factor 6” in our example), scroll through all the listings, and pause when we see copies with bar codes… Pause, look at the cover price, and if it is the US price (75¢ in our example case) then we keep looking. If it is the higher Canadian price (95¢ in our example case), then we’ve spotted one of our price variants!
Example:
I’ve just looked through the current listings in this way and found the copy below. The title of this particular listing that I found is simply “X-Factor #6 (Jul 1986 Marvel)”, so we never would have found this copy by searching on more specific keywords like “X-Factor #6 Canadian” or “X-Factor #6 Variant” or “X-Factor #6 95 Cent Variant.” Those other keywords that might lead us to these rare price variants more easily simply weren’t placed into the listing title by this seller. Because of the general lack of awareness out there about these price variants, many sellers simply don’t think about putting such qualifiers in their listing titles. So, collectors will often have to put in extra searching effort to spot these rarities by looking at all the listings for the issue broadly. But on the upside, copies found in this way and not titled as variants often go for “regular” prices… so your hard work hunting them down is rewarded!!

Here is an X-Factor #6 listing with a barcode, and the price looks like it might be 95 instead of 75 cents… so let’s pause on this one and zoom in…
Clicking on the listing to zoom in, we now verify that the price on this copy is indeed the higher price of 95 cents — and it is in this case, so therefore this copy found above is one of our rare Canadian price variants! We found one, hooray! 🙂

Yep: we’ve found one of the rare price variants!
The Distribution Rarity Figures — Setting Your Expectations For Finding These Canadian Price Variants, By Year
Learn about Canadian price variant rarity [ ENLARGE ]. Sellers are welcome to use this educational image (free usage) in listings.
By population, Canada is very small relative to the U.S., roughly the size of California in the price variant window during which these rarities were published — which put Canada at 9.8% of the North American market for comic books by population size at that time. I checked the population figures for each individual year of Marvel’s price variant window, and that 9.8% figure holds throughout (the numbers changed but in each case it rounded off to the same 9.8%).
But because all of the direct edition copies sold in comic shops across both countries are the same, and therefore only the newsstand copies in Canada are the price variants, that means their rarity was not tied to that full 9.8% of the market size, but rather was the portion of the Canadian market that was served by newsstands instead of by comic shops — in other words the price variants were a smaller share of that 9.8% figure by some amount, depending on the level of newsstand sales compared to direct edition sales.
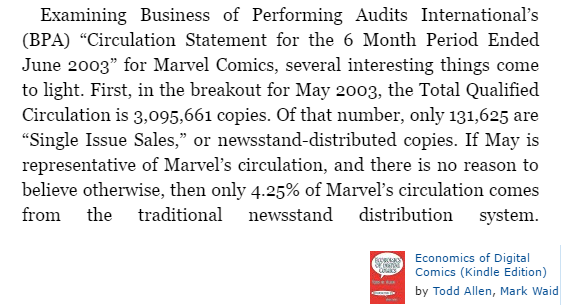
What portion of comic sales were newsstand during that time-frame? This subject has been discussed and estimated by industry insiders; for example in the book Economics of Digital Comics by Todd Allen and Mark Waid, the “mid-1980’s” is the time-frame pegged as the point where direct edition sales would surpass newsstand sales for the traditional publishers (like Marvel and DC):

A quote from Economics of Digital Comics, and a slide from Newsstand Rarity Discussion & Estimates.
Another particularly valuable discussion that I’ll get to in a moment, published by Chuck Rozanski, corroborates this mid-1980’s time-frame for when direct edition sales would surpass newsstand sales. Rozanski has written extensively about comic book distribution and is cited by Jim Shooter as follows:
“In the mid to late 1970’s, the comic book Direct Market started to evolve. The story of its origins is told better than I could ever tell it, starting here: [ this links out to part one ]. I differ from Chuck Rozanski’s accounts only in details, which are in the big picture, of no consequence. To wit, I believe that I was present for his first meeting with President Jim Galton and, in fact, played a part in making that meeting happen. … “
— Jim Shooter, Comic Book Distribution Part III
The above Rozanski link shared by Shooter is in multiple parts, and one of those parts provides 1980’s newsstand sales estimates/percentages. Shooter himself also described how by 1986, he was concerned about how the distribution pendulum had swung so far in the direction of direct edition, and came up with ideas to support the newsstand market:
“I felt that we needed the newsstand market. That, if we became completely dependent on the Direct Market, we’d wind up in the same position as when we’d been entirely dependent on the newsstand market. Up the creek without a paddle. Screwed. Helpless. At their mercy. I spoke with Marvel’s newsstand sales manager, Denise Bové. Denise was in charge of our dealings with Curtis. Like me, she felt the pendulum had swung too far. So did our Curtis account people. We came up with a number of support-the-newsstand-distribution ideas. I suggested, for instance, doing a newsstand exclusive. Why not? You know the Direct Market shops would go to their local ID’s and buy copies anyway. It would be a big hit for the ID’s, and maybe the retailers they served. And great PR in that market. Maybe get them interested in comics again. A little. That would have been in 1986. At that point, I was engaged in daily battles with the President and the other owners of Marvel.”
— Jim Shooter, Comic Book Distribution Part III
The point in time when newsstand sales were overtaken by direct edition sales was estimated by Rozanski to be in that same 1985/1986 time-frame that Shooter is talking about above.
So at some point around this general timeframe, it is fair to assume that half of Marvel’s comic book sales were made on newsstands, and half as direct editions from comic shops. Applying this concept to our price variants, one way to draw a rough “mental picture” of this level of distribution rarity within the North American market is to first picture the United States and then “copy and paste” an extra California… because by population, Canada contains an “extra-California-worth” of people. And then you must divide that extra California into direct edition versus newsstand comic book distribution.
The distribution percentages were also estimated to have changed year by year, with the 50/50 point falling within our price variant window, but with a decline the percentage of sales on newsstands over time. I’ll get to that year-by-year estimated breakdown in a moment based on the estimates Rozanski has published, but first, here is a graphic of the “extra California” concept just to help in drawing a “mental picture” of the kind of rarity we’re dealing with when it comes to these Canadian price variant comics at that 50/50 point:
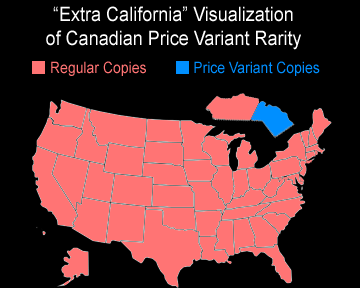
Canada had a population roughly the size of California during our price variant publication window, and only a portion of that “extra-Califoria-worth” of people bought their comics on newsstands.
But although the 50/50 point of newsstand versus direct edition comic book distribution falls within our price variant window, that window is also fairly large, spanning multiple years. Changes in distribution over those years towards a higher direct edition percentage would arguably make later year price variant comics more difficult to find as a percentage of their totals (all else equal), than earlier year comics.
So when setting our expectation as collectors about how relatively difficult it would be to track down a given Canadian price variant comic book, let’s set our expectation that the later the publication year, the more difficult it may be to find, all else equal. In “Modifications to the Distribution System,” Chuck Rozanski revealed the following information about newsstand versus direct edition sales figures by year in the 1980’s:
“Because I had such a personal vested interest in the growth trends of the Direct Market, during the early 1980’s I quizzed everyone at Marvel who would give me figures as to what impact comics shops were having on the sales at company. I derived the following estimated numbers specifically from conversations with Jim Shooter, Ed Shukin, Michael Hobson, and Carol Kalish:
1979 Direct Market 6% of Marvel’s gross sales
1982 Direct Market 20% of Marvel’s gross sales
1985 Direct Market 50% of Marvel’s gross sales
1987 Direct Market 70% of Marvel’s gross sales
While the exact figures may vary slightly from my derived estimates, the fact remains that Marvel’s choosing to open up their distribution system to new entrants in 1979, and providing working capital at the same time, turned out to be the turning point in the history of the company. In fact, if you consider that the expansion in market share by the Direct Market was paralleled by the simultaneous collapse of the newsstand business, it becomes clear that Marvel Comics would not have survived the 1980’s without the robust growth in comics specialty shops.”
A couple of notes: first, note that he says gross sales, not net sales, and it is unclear what a net number might be net of, and could explain why there is a difference to another of his articles about Marvel’s direct edition to newsstand distribution which pegs 1986, not 1985, as the year direct would surpass newsstand (and illustrating that this is all very much estimation, even by industry insiders). Something else that’s important to keep in mind is that comics sold across the newsstand distribution channel were actually returnable (i.e. any unsold copies could be returned for a refund), while direct edition sales by contrast were final/non-returnable (but in exchange for that commitment the comic shops got their copies at a large discount — note that that’s why such copies have a logo in place of a bar code, with that logo in order to distinguish them as non-returnable). Because the direct edition copies were heavily discounted, if Rozanski’s estimates are for dollars of sales, that’s different from number of copies sold — I mention all of these differences because they may factor into why his estimates differ across two different articles, one pegging 1985 as the 50/50 point, the other pegging 1986. The articles were also written at different times, and may have incorporated different information.
Also, the picture Rozanski paints of a steady newsstand decline appears to correlate with Shooter’s battles to help the newsstand, where that “newsstand exclusive” idea was shot down and the “brass” at Marvel were determined to favor the direct market. Here’s another quote from Shooter:
“The Direct Market was easy money, quick money, sure money to the brass — not that any of them had ever set foot in a comics shop or even opened a comic book. To them it was about moving the units and collecting the cash. Might as well have been widgets we were selling. But, they knew the Direct Market was shooting fish in a barrel. Why jeopardize that? Circulation V.P. Ed Shukin, both Kalish and Denise’s boss, kept his head low and his mouth shut. He knew which way the wind was blowing upstairs. So, Denise and I lost and Kalish won. I was gone from Marvel not too long afterwards, so, it was my problem no longer. Kalish passed away in 1991, but ultimately Marvel arrived where she wanted it. And that’s where we are now.”
— Jim Shooter, Comic Book Distribution Part III
So I think the information and estimates shared by these industry insiders definitely supports the notion that direct edition sales “took over,” and, the percentage of comics sold on newsstands trended lower and lower as the years went on. Just how much lower by percentage at any given year is indeed just estimation; when we go out to much later years, Rozanski would later estimate that Marvel’s newsstand percentage was down at 2% by 2005 and 1% by 2013. These later year estimates are so low as to raise a skeptical eyebrow — but it is also within the context of the demise of newsstand sales at Marvel, where Marvel actually pulled the plug on newsstand sales in 2013, and Marvel’s David Gabriel then revealed that Marvel had actually ended sales to most newsstand outlets years earlier before ending newsstand sales in 2013 across those last newsstand outlets (the last ones being Barnes & Noble and Books-A-Million):
“Gabriel confirmed that Marvel’s single-issue comics program to bookstores has been ended. He said that Marvel ended newsstand sales of print comics “about two years ago,” and the single-issue program at BAM and B&N “ended almost three months ago to no fanfare or notice from the comics industry.” Gabriel said “the business in the direct market [the comics shop market] is a much stronger model and try as we might, we have not been able to make the comics newsstand model work for years, I don’t think anyone has.”
In the book Economics of Digital Comics by Todd Allen and Mark Waid, a May 2003 report is cited which would have put newsstand sales at an estimated 4.25%:
This slide is part of my post entitled Newsstand Rarity Discussion & Estimates where I have collected quotes and graphics related to the discussion of relative newsstand rarity over the years, compared to direct edition copies.
A great comics research resource, Comichron, estimated industry-wide 2013 newsstand comic book sales of only $25 million versus comic store orders (direct edition) of $340 million — add those two numbers together and we reach a total of $365 million. Divide $25 million into that total, and that would put the estimated newsstand percentage at 6.8% for 2013, versus direct edition at 93.2%. Since Marvel’s newsstand sales had been in wind-down mode for some years, it is logical to conclude that their newsstand percentage would have been below the industry-wide percentage. So it is understandable that we’d see estimates for Marvel some amount lower than the industry-wide 2013 number.
Anyone making these newsstand-vs-direct edition sales estimates is trying their best and their numbers for any given year they have attempted to estimate could be off; Rozanski put out his 1980’s estimates after careful thought and discussion with Marvel insiders, so I think it is valuable to use and extrapolate them, in order to make further estimates of what was going on with the rarity of the Canadian price variants — which themselves were a newsstand-only phenomenon — with the caveat of all these notes above and that we’re now entering the realm of estimation based on someone else’s information which itself was estimation. Having made these notes/caveats, if we now take his 1982 figure of 20% direct edition, and then we increase the direct edition market share by 10% each year, it “fills in” perfectly. Here’s what I mean: below are his figures in bold, and my “fill-ins” in italics… notice it works out pretty much perfectly to pencil in a smooth rise of direct edition distribution in this way:
1982: 20%
1983: 30%
1984: 40%
1985: 50%
1986: 60%
1987: 70%
1988: 80%
Before proceeding to use these above distribution numbers to make further estimates, I also want to point out that cold hard CGC census data also exists which we can look at… CGC denotes these comics as “Canadian Edition” on their census. [ May 2019 UPDATE: CGC announced that as of May 6, 2019, they will label as “Canadian Price Variant” going forward 🙂] So although distribution-percentage-based estimates can give us a good ballpark sense of how difficult it will be to find a Canadian price variant comic book from any given year out there, original distribution and survivorship are two completely different discussions… And newsstand comics are notorious for having a high destruction rate. So when you compare the figures I’m about to lay out against the actual CGC census data, you will find that the numbers in my table will run high compared to the CGC census rarity.
With these caveats stated, here is how the distribution rarity numbers would look when we take the 9.8% of the North American market for comic books by population that Canada represented, and then we divide up the Canadian market using our direct edition percentages by year, within 10% range, in order to estimate the portion of the total North American comic book sales that were our price variants (i.e. that were distributed and sold on newsstands in Canada):
| Year | Est. Price Variant Distribution Percentage |
| 1983 | 6.86 – 7.84% (using ~20-30% direct edition assumption) |
| 1984 | 5.88 – 6.86% (using ~30-40% direct edition assumption) |
| 1985 | 4.90 – 5.88% (using ~40-50% direct edition assumption) |
| 1986 | 3.92 – 4.90% (using ~50-60% direct edition assumption) |
| 1987 | 2.94 – 3.92% (using ~60-70% direct edition assumption) |
| 1988 | 1.96 – 2.94% (using ~70-80% direct edition assumption) |
So what this picture paints, is that when seeking a Canadian price variant published closer to the beginning of the window, you will most likely find copies are somewhat easier to come across… while comics published closer to the end of the window are going to be far more scarce as a percentage of the total, all else equal. Having a ballpark distribution percentage, we can then make some further calculations about the likely number of price variant copies that made it out there, starting from probable total sales numbers for a given comic book issue.
For our example from earlier, X-Factor #6, this source pegs the print run at 340,000 total copies. Published in July of 1986, we can then apply our estimated distribution percentage against that total to ballpark the number of Canadian price variant copies. From the table, let’s round up to an even 5%, as that makes for easier math that we can do in our heads — because we can just take 10% of the total print run and cut that resulting number in half, so in other words first we take the total print run and move the decimal place over to the left (to get 34,000 copies likely sent up to Canada) and then we cut that in half to arrive at our estimate of 17,000 95 cent price variant copies. This exercise is estimation, but can help “calibrate” our sense of how difficult it would be to find 95 cent copies of X-Factor #6 out there… but we can also look at the CGC census data as well for supporting evidence of relative rarity, where only 0.4% of the copies on census are the Canadian price variants (which are listed with the name “Canadian Edition” when you do a census lookup):
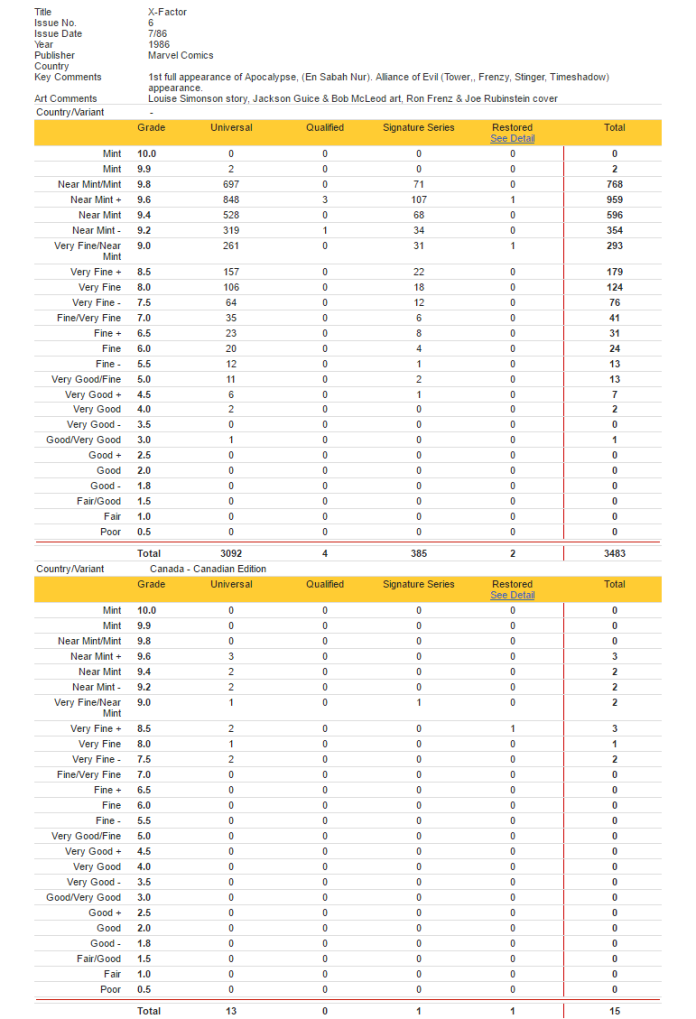
X-Factor #6 CGC census lookup as of this writing shows 15 Canadian price variant copies, or 0.4% of total copies that have been graded.
You can start to see the low newsstand survivorship expressing itself in this low census count, at what works out to 0.4% of total copies graded. That’s not 4%, that’s zero point four percent. If we assume that the ~4% original distribution figure from our earlier table is a good estimate, the actual CGC census result we’re seeing here is only one tenth of what we might have been expecting to see…
But this makes some sense when you consider that these variants may have been slow to move South by way of comic trading among collectors, and the shipping cost for Canadians to make CGC submissions sets a different bar than collectors have in the USA. And then we should also consider how these price variants were newsstand-only distribution, and the typical newsstand buyer was a reader, as opposed to a collector carefully preserving their copy (the typical collector was taking home a regular direct edition copy from their local comic shop). We also have to consider that these price variants are still overlooked and “under-the-radar” and so low grade copies are not going to be viewed as grading candidates. Compare for example against the situation with Star Wars 35¢ Price Variants, where even a low grade CGC 3.0 copy of the price variant for issue #3 recently auctioned off for over $300… In that market price situation, someone owning even a low grade copy might consider sending it to CGC. But it would not make sense for low grade copies of our Canadian price variants (not yet at least, sitting here in 2016) and we can see that in the grade breakdown — every price variant copy is 7.5 or higher. My read on this is that copies under 7.5 surely exist out there, they’re just not being selected as grading candidates to send in to CGC and so we’re not seeing them in the census numbers today.
Also notice that there are zero price variant copies in 9.8… This also makes sense, when we consider that newsstand staff were not trained to handle comics with any semblance of care, and all but the lucky “sandwiched” copies sustained some amount of damage the moment they hit those metal racks. So even for the collector buying their comics off of newsstands, it would be highly unusual (or maybe highly “lucky” is the better word) to be able to take home a NM/MT condition newsstand comic.
This grade disparity is another factor to take into consideration when collecting these, and setting a lower bar of targeted condition is warranted… because in the case of X-Factor #6 as our example, if you are so demanding about grade that you prefer to sit back and wait for a CGC 9.8 copy to hit the market then guess what? In the case of X-Factor #6 it has been thirty years since publication and there are no Canadian Edition CGC 9.8’s! You’re literally growing old waiting for that CGC 9.8 copy to come into existence! So set the bar lower, would be my advice, realizing that these price variants are a newsstand-only-phenomenon… So in the context of how they were distributed, I’d argue that even VF+ is a very strong grade for these.
Spotting Canadian Price Variants — Two More “Cases” To Know About
Going back to my three step method to spot Canadian price variants, I want to give you two other cases to know about: the case of a comic you’ve decided to look for where you’re actually just before the price variant window, and, the case of a comic you’ve decided to look for where you’re actually just after the price variant window.
Other Case #1: Just Before The Window
If you’re attempting to go through the three steps from earlier, but for a comic published just before the window — meaning you’ve picked out one to look for that is actually too early for a Canadian price variant by publication date — then you’re going to find something that looks like this when you get to step 2 (the step where you zoom in on the price box):
This is an example comic that was published just before the window (too early to have a price variant). There is no alternate Canadian price listed.
You’ll be looking for the alternate Canadian price at this step… and not finding it (in the above example, which is a direct edition copy Wolverine Limited Series #1, the same 60 cents was charged across the US and Canada; the only alternate price is 25 pence for UK sales). The one 60 cent price traces back to the reason we have a price variant window in the first place… currency exchange rate. Immediately before our window, in the 1970’s, the US to Canadian dollar bounced around near parity and therefore publishers could charge the same 60 cent price if the buyer was paying in US dollars, or if the buyer was paying in Canadian dollars. Sometimes they came out slightly ahead, sometimes slightly behind, depending on the exact moment the currency was exchanged, but over time it balanced out and there wasn’t a real need to think about charging a different price to Canadians. In the chart below, look at the blue line in the beginning section of the chart before the 1980’s begin… relatively stable (bounces around near parity). Then as the 1980’s begin, the exchange rate starts to spike dramatically with no signs of reversing course. By late 1982 it had moved so far that publishers basically had no choice — buyers had to be charged more when paying in Canadian currency. And that decision point is when our price variants begin.
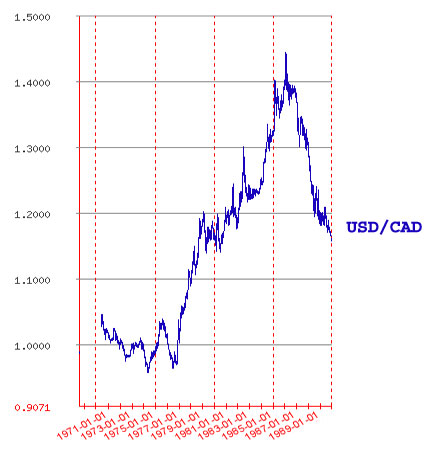
This chart shows the U.S. to Canadian dollar exchange rate, during the 1970’s and 1980’s. Notice how it bumped around near parity (1 for 1) during the 1970’s but then spiked dramatically during the 1980’s.
Other Case #2: Just After The Window
If you’re attempting to go through the three steps from earlier, but for a comic published just after the window — meaning you’ve picked out one to look for that is actually too late for a Canadian price variant by publication date — then at step 3 when you pull up a newsstand copy to check the price box you’re going to find something that looks like this (follow the yellow arrow — I’ve enlarged the price box in the picture below):
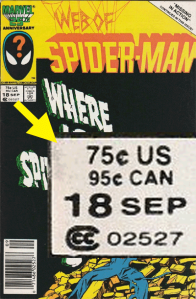
As you can see, this newsstand comic is past the price variant window, because it carries both prices, covering both countries.
This comic is too late for a separate Canadian price variant, because the publisher has now already “merged” the two newsstand print runs into one, i.e. newsstand copies now carry both the US and Canadian prices on them, the same way direct edition copies did throughout.
Rare Canadian Price Variants To Collect
Using my three-step method to spot Canadian price variants, for any given comic you own you’ll be able to answer the question: “Is my copy a Canadian price variant?” But you’ll also be able to identify and seek out the price variant for any particular comic you may be actively looking to collect, if it was published during the window where these exist. The window is large enough that there are countless interesting comics one could look to collect… To give you some ideas, I’ve shared a slideshow of several examples I found interesting, from among “keys” and personal favorites: Start Slideshow.
Happy Collecting! 🙂
Other posts on the subject of Canadian price variants:

You say “the later the publication year, the more difficult it will be to find.”…and then base that on Chuck Rozanski’s very, incredibly loose “estimations” of the “size” of the newsstand market at the time.
But your statement isn’t necessarily true, and there’s no way to prove it.
You also state that “gross sales” and “net sales” has to do with the returnability of newsstand books. This is not true. Sales are SALES, not DISTRIBUTIONS, and newsstand SALES accounts for books that are reported SOLD…not returned, which obviously haven’t been sold at all.
Your “fill in” numbers are estimations which are, themselves, estimations of estimations. Looks good to those who don’t know better, but doesn’t work when carried out…obviously it doesn’t work for 1989, which you didn’t include, and that’s just based on Chuck’s own numbers.
You also don’t consider the relative value of books from those years (1982-1988), nor do you mention the fact that Marvel, which accounts for the vast bulk of submissions of books from the 1980’s), stopped printing Canadian newsstand variants in 1986 (except in passing at the beginning of the article), and how this impacts your “percentages.”
Further, your “distribution percentages” are based on the entirely made-up idea that the population percentage has anything but the loosest correlation to print runs. So, you say “well, in those years, Canada was 9.8% of the population, so if you use Rozanski’s (totally made up, remember) numbers, you arrive at these percentages”…which totally ignores the fact that you don’t really know if those numbers are even close to being accurate. You use the broadest and most unrelated “estimates” there are, then try to come up with accurate estimates based on what you and Chuck and others think “sounds good”, with no actual REAL data to support any of it at all.
You also don’t mention the OTHER Canadian newsstand price variants, like Archie, that exist during this time period.
Remember: Chuck’s numbers come from information that he obtained, as HE HIMSELF admits, in the EARLY 80’s. How, then, can that information be used to estimate what was happening in 1987, for instance…? The market had VASTLY changed between 1982-ish and 1987!
Don’t you think this information is important?
LikeLike
Thanks for reading and commenting!
Re: “the later the publication year, the more difficult it will be to find” — The notion that newsstand distribution declined over time (and direct edition distribution increased), and therefore later year variants would be more difficult to find than earlier year variants, is meant to be an “all else equal” comparison where I’m suggesting that for two comics in the variant window with similar total print runs but separated in time, the one published later in time should have fewer variants outstanding than the one published earlier in time. So in other words, the percentage of the print run that should be price variants gets lower over the years of the variant window.
This is supported not just by Rozanski’s newsstand estimates — which he shared as being just that, estimates — but I think my rarity percentage claim is also supported very clearly by the CGC census data: because as we move later in time, and compare keys from different years, the percentage of total copies that you will find on census which appear labeled as “Canadian Edition” is lower. And then consider the observed rarity by actually trying to find these: You will find a markedly different experience trying to find price variants out there in the marketplace which were published in the beginning of the window, versus closer to the end. Please find me a NM 75 cent variant copy of X-Men #201 for example, published 1986 (last year of Marvel’s window) — you’ll find the task is unbelievably frustratingly difficult… they’re just not out there.
My discussion of Rozanski’s figures and my “estimates of estimates” are absolutely positively estimations but I think it is fair for an industry participant like Rozanski to publish his estimates and I further think it is fair for collectors to discuss them, extrapolate them, and think about comics in the context of those estimates as one piece of the puzzle of total consideration given to those comics. Highlighing just how much these really are estimates, Rozanski’s own numbers differ when drawing from different writings of his (which may be a gross versus net sales difference as a possible explanation but I do not know for sure; whatever the reason, it was something I thought worthy of pointing out). Estimates can still be useful when thinking about things on a “theme” level, and fortunately we do also have cold hard CGC census data we can look at for those out there who would prefer to move past estimates and look at the official count of graded copies as a better source of information to draw conclusions about, with many keys having a large sample size of census data.
Yes: the relative value of different comics is a consideration in all of this, as is the idea that from issue to issue we really don’t know what the sell-through was on the newsstand… An issue that sold very well on newsstands and saw a smaller level of returns would — all else equal — be easier to find than if it sold poorly and saw high returns and where those returns were pulped. And this is a major variable given that the publisher may have produced three or more copies for every one that sold on the newsstand.
With regard to different publishers, I’ve written a few separate posts about these Canadian variants, one focused on Marvel, one focused on D.C., and the one you commented on here was really meant more to be about how to spot them in practice as the theme, so a lot was left out including any special mention or discussion of Archie. Archie indeed published Canadian variants too, it just hasn’t been a focus of mine so I haven’t posted about it specifically or investigated their own window.
I’m not sure why you would take issue with the idea that Canada at 9.8% of the population would likely have only been distributed 9.8% of Marvel’s comics… Although I did not discuss per-capita comic book consumption (nor do I know what it was — i.e. was the typical Canadian more or less likely than the typical American to be a buyer of comic books), the notion of discussion of the size of the market for comic books by population size is entirely reasonable: on an “all else equal basis” if one area of North America has 9.8% of the people, they should consume at least roughly that same percentage of the comics. I don’t think one needs further data than population size to draw a basic logical conclusion about the relative size of the market for comic books between our two countries.
Best,
– Ben
LikeLike
“So in other words, the percentage of the print run that should be price variants gets lower over the years of the variant window.”
The answer to that is “maybe.”
It’s not necessarily the case. The Canadian price variants were only published for a small window: 1982-1986 for Marvels, and 1982-1988 for DCs (and about 1992-3 for Archies.)
Remember: Rozanski’s numbers are very, very, VERY broad estimates, based on conversations he had with people before the vast majority of the books under discussion were published.
Was the newsstand in decline in the 80’s? Of course. Was it in the decline that Rozanski suggest? Almost certainly not. So does that mean that, if a copy of ASM from 1983, with the same OVERALL print run (Direct AND newsstand) as a copy from 1986, would necessarily have a lower print run of the Canadian price variants? Not at all! There are so many factors that are left out of that that it renders such a conclusion so broad as to be functionally useless.
Even “all other things being equal” doesn’t work, because all other things aren’t equal. For example, the print runs of a title like Batman were higher in 1987-1988 than they were in 1984-1985, due to the increasing popularity of the character in that time frame. Thus, the Canadian variants for issues #400-#423 are far, far more common than the issues from #370-#399.
” but I think my rarity percentage claim is also demonstrated very clearly by the CGC census data:”
No. As I said before, and I cannot stress enough, it is simply not possible to use the census in the way you are trying to use it, at this time. It is too young, and the data is far, far too sparse, to be of any use.
CGC has graded about 3 million comics. That’s less than the print run of most regular single issues of Walt Disney’s Comics and Stories from the early 50’s. There are literally hundreds of millions, if not billions, of comics that exist in the world.
The census is simply too young to be bearing much of anything out yet.
“Please find me a NM 75 cent variant copy of X-Men #201 for example, published 1986 (last year of Marvel’s window) — you’ll find the task is unbelievably frustratingly difficult… they’re just not out there.”
You’re using isolated examples to prove the larger point. Certain issues can be very hard to find for sale, but that doesn’t mean they are any rarer (or less rare) than earlier issues. Issue #208, for example, is quite common.
“My discussion of Rozanski’s figures and my “estimates of estimates” are absolutely positively estimations but I think it is fair for an industry participant like Rozanski to publish his estimates and I further think it is fair for collectors to discuss them, extrapolate them, and think about comics in the context of those estimates as one piece of the puzzle of total consideration given to those comics. ”
What does Rozanski’s status as an “industry participant” (whatever that means. I’m an “industry participant”, too…what value is that if your information is wrong?) have to do with anything?
Estimations are, essentially, opinions. Not all opinions are equal. For estimations to have value, they have to be 1. based in reality, with hard numbers; and 2. free of ulterior motives like trying to justify one’s asking prices.
Chuck’s numbers are made up. He doesn’t support them, he doesn’t cite anything but nebulous “conversations” he’s had by others, and….this is the single most critical part of the entire discussion: they are OPENLY REFUTED by PUBLISHED, DOCUMENTED numbers from the PUBLISHERS THEMSELVES (see Amazing Spiderman SOO for 2005 and 2008.)
So how can you possibly use those numbers to come up with your own? They are pulled from thin air, based on a “feeling” and the (nebulous) knowledge that, yes, newsstand variants ARE harder to come by as the years go by.
It would be like estimating the population of the United States in 2016 based on the number of immigrants who left Italy between 1920 and 1930. There’s simply too much information missing, and wrong, to make such an estimation valid in any way.
“I’m not sure why you would take issue with the idea that Canada at 9.8% of the population would likely have only been distributed 9.8% of Marvel’s comics”
Because it’s a made-up number. How do you know it’s not 5%? Or 20%? Or 3%? Did Canada have a proportionately equivalent population that was buying and reading comics from 1982-1988? Did Canada’s newsstand buyers have a proportionately equivalent number to US newsstand buyers?
You don’t know, and neither does Chuck, and neither does anyone except those working for and with Marvel at the time. And, while it’s a reasonable BROAD estimate, using that number, as you have done, to draw narrow conclusions would be inaccurate, to say the least.
Do we know, for example, that the SOOs contain information for ALL English language Marvel comics…? Or just those published and sold in the US…? Do the SOOs include numbers for the US, UK, and Canada, as the Direct price suggests, as well as the newsstand in both the US and Canada…?
“if one area has 9.8% of the people, they should consume roughly that same percentage of the comics.”
Says who…? Not trying to be contentious, here, it’s a valid question. Why would Canada…a different country than the US…consume “roughly the same percentage of the comics”…? According to what information do you base this off of? Hunch?
France consumes more comics as a percentage of its population than the US. So does Japan. So does Belgium.
What reasoning, other than size, makes you think the proportional consumption is the same…? Proximity?
“I don’t think one needs further data than population size to draw a logical conclusion about the relative size of the market for comic books between our two countries.”
Sure one does! It’s not a reasonable estimation at all, without knowing a whole lot of other factors, some of which I’ve just discussed.
LikeLike
Thanks for your comments… Regarding Archie’s window, I haven’t investigated start and end dates myself but I’d let you know that I have a Canadian Edition TMNT Adventures #1 from 1989.
Regarding the rest: I recognize that many of the facts that would lead to concrete figures are unknowable, for example you’re right that I do not in fact know the per-capita comic book consumption in Canada in the 1980’s, versus the per-capita comic book consumption in the United States. (Does anybody have those figures?) I’d think that given the French speakers up there in certain areas, that an assumption of equal per-capita consumption of Marvel’s English language comics would fall on the side of conservative if anything. But I do not know; I do not have per-capita comic book consumption facts to draw upon. I do believe there is a strong cultural overlap making Canada more similar to the US as a market for Marvel’s comics than, say, Japan or Belgium; for example Canadian baseball teams play in the MLB, many pop culture figures in our culture are Canadians (and vice versa), Canada was part of our Space Shuttle program (the Canadarm in the Atlantis space shuttle for example). Canada is a foreign country but it is arguably “special” compared to other foreign countries in our relationships and cultural overlaps. There have been Canadian superheroes introduced (such as Wolverine) but I am drawing a blank on any Belgian superheroes in the Marvel universe. But these things are anecdotal and not hard numbers… If you happen to know the relative per-capita comic book consumption numbers for Canada and the US please share them, as it certainly would help refine the estimates — but please don’t forget that in the end, that’s all I was doing: an exercise of estimation. A bottom line take-away was meant not to be that the number of X-Factor #6 variants was my estimate on the nose, rather, to take away that Canadian price variants are a more rare choice collectors can go for when targeting a given issue for their collections. And if we can see how they’d be more rare by applying some reasonable logic and observations (at least I think my logic and observations were reasonable), including observing the relative rarity showing up in the albeit-young CGC census numbers, then given that the variants are obtainable in the marketplace for little to no premium (such as that X-Factor #6 listing I highlighted where the seller didn’t even title it as such), why not go for those as a collecting preference?
I concede that I don’t have the relative per-capita comic book consumption numbers for the two countries — but does that mean absent that perfect information, that I should just throw my hands in the air and not even try to figure out if Canadian Edition comics are a rarity worthy of collector attention? That seems kind of defeatist when in the alternative one could just presume equal per-capita comic book consumption as your base case, do some analysis on that basis, and then also check the reality of the marketplace availability — and the CGC census count — to get additional inputs and a feel for whether the conclusions ring true. Early collectors of 35 cent variants weren’t operating with perfect information either, and before 1998 those price variants were similarly “under-the-radar” of most collectors as a “class” of comics — but if those early collectors who found themselves interested in investigating 35 cent variants had let imperfect information be a “roadblock” to reaching a conclusion that those were in fact more desirable, that would have been an unfortunate decision indeed! Instead, anyone who collected those variants while they could still be obtained for little-to-no premium, fast-forwarding to today’s values is quite happy. There’s no downside to preferring the more rare version, if the price is close enough to own the one version over the other… the long-term outcome as far as value will still reflect whether the value of the issue number in general rises or falls over time, but having the more rare price variant is another way to win. I’d rather have two ways to win, than one, when collecting a given comic.
And I understand your point that the CGC census is young and the numbers may evolve. Especially given that newsstand comics, tending to be in lesser shape, are arguably not as likely to be deemed grading candidates and sent in to CGC in the first place, but might get sent in down the road if values justify doing so… I discussed that in the post. Plus, that I do not know just how much “migration” the variants have had South, nor do I know the relative likelihood of a Canadian making a CGC submission versus someone in the U.S. given for one thing their different shipping cost hurdle. So, drawing upon today’s CGC census percentage and saying that’s therefore the percentage of Canadian variants at distribution would be flawed logic. But I’m not making that argument, I’m referring to the CGC census as supporting evidence of relative rarity, I still believe it is useful the same way an opinion poll is useful in sampling, especially for issues with a thousand+ submissions where the sample size is large, and the bottom line is: I’m suggesting that if the variant cover price version is the more rare choice to collect for a given issue, and if it can be acquired with very little premium, that’s the version I want to collect. That’s my own conclusion, I shared how I got there, and anyone is free to agree or disagree!
Best,
– Ben
LikeLike
Time will tell a tale of rarity here The Canadian market would mirror USA. The difference would be slim. This holds true from bubble gum to television sets, to try to use the excuse that we just dont know exactly is sooooo weak and pathetic of an argument. Canadians and American share alot of the same history. There will be certain issues that will reflect a more or less demand.. The people who argue this usually dont want this to be true because it doesn’t work for what they want to happen (it minimizes their collections). Everyone that i knew IN CANADA in the 1980s threw MOST OF THEM OUT. I can list the most rare 95 , 75 cent variants based on what the comic stores sold were i worked., I asked general store owners about what they got and sold, or what other collectors were buying and why.I also base it on the last 10 years trying to find these issues. some are very difficult, Difficult, and other price variant comics, are just extremely difficult to come across.
Ill give you 3 titles that are very hard to find:
**Doctor Strange (near the end of the series 75 cent variants, that published every 2 months, due to lower demand)
**Ghost Rider 75 cent variants (near the end of the series run, and its popularity plummeted, hence lower print runs on all Ghost Rider variants) this hold especially true to the very very low print runs of 75 cent G.R. issues
**Ewoks 75, 95 centers…
LikeLike
Hi Allen, thanks for reading and commenting! Since the time of my original writings on Canadian price variants on this blog, I’ve actually had more than one reader from Canada independently reach out to me (via comments on other posts) to let me know that a 9.8% Canadian-market-share assumption they feel actually overstates the true market share, arguing that a portion of French-as-a-first-language Canadian citizens in the 80’s would not have purchased Marvel’s English language comics, and therefore the market share percentage used in estimating Canadian price variant rarity should be reduced from the simple-population-split percentage. I find this argument entirely reasonable and it would support the idea that using the World Bank and US Census population data to derive a likely Canadian market share percentage for Marvel’s comic books lands on the side of conservative, if anything.
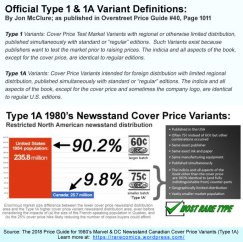
I also had another reader reach out to me, a huge fellow price variant enthusiast, where we have had an extensive email correspondence about various price variants, and they were extremely knowledgeable on the subject and also extremely well read — and they suggested I pick up a copy of Overstreet #40, where an article by Jon McClure appears (but this seven-year-old article is nowhere to be found online; I searched first but came up empty, so I ended up purchasing a hard copy). I hadn’t even known that article existed before he mentioned it to me! I am very glad I made that hard-copy purchase, because McClure’s article alone was worth the cost, and, it independently corroborates the exact logic that everyone who studies these variants is bound to come up with (just like I myself did): that some share of Marvel’s comics went North of the border, that the size of that share was driven by population size, that this North-of-the-border share was then split between newsstand and direct edition, and that everybody who has weighed in on newsstand-vs-direct-edition rarity numbers pegs the 50:50 point of newsstand:direct as falling somewhere within the 1980’s Canadian price variant window.
Here is a brief quote from the article:
“In the 1982-1986 period about 10% of Marvel’s print run was Canadian, with Newsstand and Direct Market editions split at about 50% each; because Newsstand editions have a far lower survival rate than Direct Market Editions, Canadian Newsstand editions may be as scarce or scarcer than Pence price variants, with both estimated to have original print runs equivalent to 5% of U.S. print runs, but with an estimated survival rate of only 1-2%.” — Jon McClure, A History of Publisher Experimentation and Variant Comic Books
So in the first line of this quote, McClure is sharing with us that “about 10%” of Marvel’s comics went North of the border — which makes perfect sense because it would follow the population share almost precisely; the exact population percentage for Canada versus the USA in this period works out to 9.8% vs. 90.2% using the World Bank and US Census population data, so a round-number 10% makes complete sense to use as a benchmark. It is way easier to deal with “10%” when doing math around the print run numbers, as it allows one to simply move the decimal point (or chop off the last digit) to figure out how many copies went North.
Next, McClure is conveying that out of this 10% share of Marvel’s comics that went North of the border during the 1982-1986 period, about 50% were Newsstand and about 50% were Direct Editions, meaning that the variants as newsstand-exclusives, were therefore at a level of 5% of each issue (splitting the 10% in half). What McClure has presented here in a few sentences is essentially exactly what I arrived at in this post, but with the added detail of working on breaking out the likely rarity year-by-year (rather than peg the rarity of the entire variant window in “broad strokes”), using what Rozanski shared about the downward-sloping newsstand percentage, such that the newsstand percentage would have been higher at the start of the 1982-1986 period and lower at the end of that period. But for McClure to encompass the whole price variant period with a broad-brush 50:50 split is entirely reasonable for a broad estimation of variant rarity as a “class” (i.e. some individual examples might be on the side of more rare, some on the side of less rare, but I think that overall, it is entirely reasonable to make a “rule of thumb” estimate as he has done here, at 5%).
And then he goes on to estimate the survival rate for the Canadian price variants at 1-2%, noting how newsstand comics have a far lower survival rate versus direct edition comics. Seeing this 1-2% estimate mentioned by McClure reminded me how I myself studied the CGC census data for Amazing Spider-Man #252 going back to 2001, and I found that the census rarity percentage for the variants ranged exactly in that 1-2% band for the past decade-and-a-half+ period (https://rarecomics.wordpress.com/2016/12/13/amazing-spider-man-252-75-cent-canadian-edition-variant-rarity-over-time/).
Best,
– Ben
p.s. Thank you to the reader who suggested I pick up a copy of OPG 40 — you know who you are — as reading the article by McClure was alone worth the hard-copy cost and I was so glad to read about all the different types of variants he covered, but especially what he had to say about the Type 1A variants!
I was also quite struck by how Jon McClure described his first telephone call to Bob Overstreet, back in 1997, to report his findings about 30 and 35 cent variants, as follows: “I told him I had discovered several hundred Marvel comics that nobody knows about. His response was immediate: ‘That’s impossible! Marvel is the most heavily-researched comics company ever!”
McClure also described an Overstreet Advisors meeting in 1999, where he presented his findings about 30 and 35 cent variants, as follows: “When I presented my findings at the Overstreet Advisors meeting in Baltimore in 1999 and explained that the Marvel price variants were eventually going to be the most valuable books published after 1964, I was considered insane and treated with mockery and derision by the majority of attendees.”
So in 1997 — a full two decades after the 35 cent variants were published — the initial reaction of Bob Overstreet himself to McClure’s findings was one of disbelief… Talk about overlooking a “class” of comics! And from McClure’s quote describing the 1999 meeting, it sounds like he was practically laughed out of the room when he suggested the enormous future value potential of the 1970’s price variants. Can you imagine?! Instead of the rarity mathematics and what that meant for future investment potential “clicking” as it should have done, they were so stuck in the past (why would they be worth anything that substantial in the future if they hadn’t for twenty years?), that they treated McClure in a way that made him feel mocked and derided… In retrospect, that’s crazy!!
LikeLike